
Finagraph gathers financial data for deeper insights.
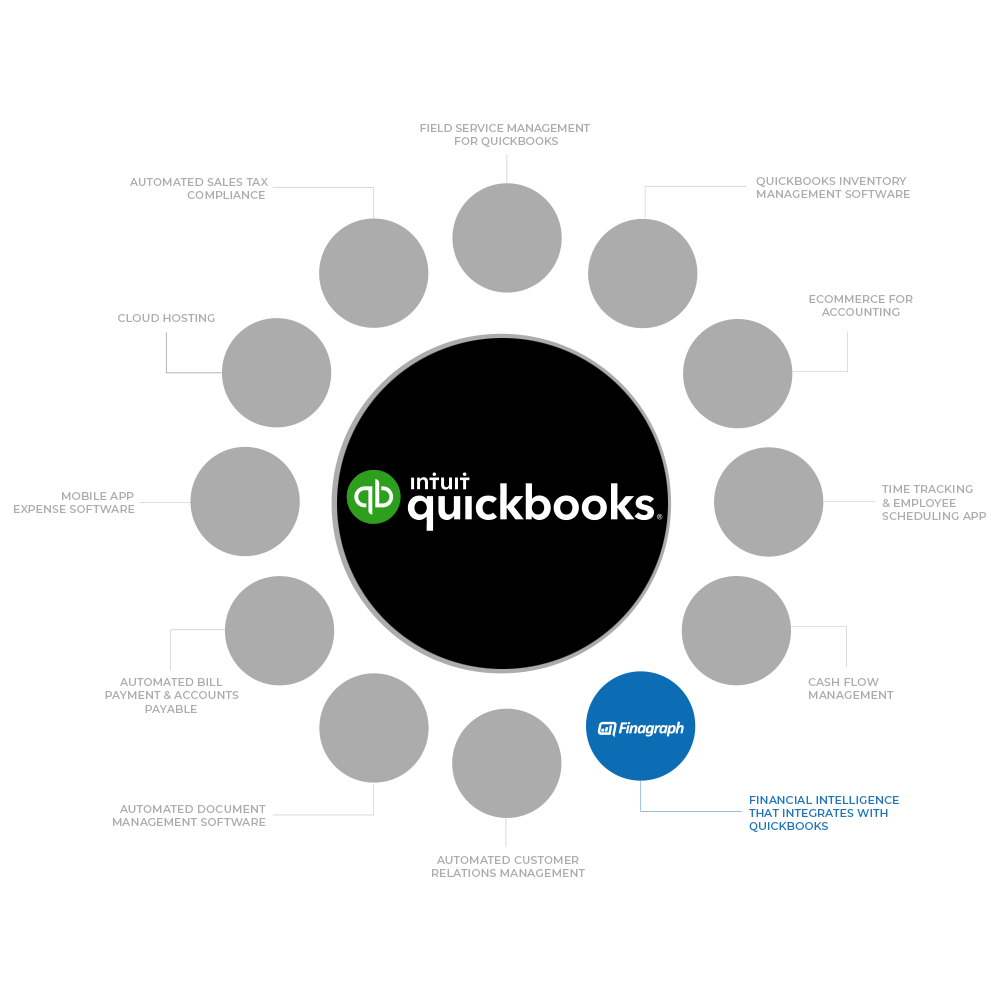
Linking directly with QuickBooks®, Finagraph instantly displays visual insights pinpointing the quickest ways to impact the business and strengths that should be leveraged.
Finagraph collects, processes, and analyzes financial data from small businesses with 100% accuracy, at lightning speed.
Build your QuickBooks ecosystem with custom applications.
finagraph
Seamless integration with popular business accounting packages.
Leave the number crunching to the CPAs. Finagraph unlocks the details in QuickBooks for Windows and QuickBooks Online so you don’t have to enter any numbers or run any reports. It’s all automatic with the click of a button.
See instant visual trends with the click of a button.
Detailed numbers are powerful, but it can be easy to get lost. In addition to the raw details, we’ve incorporated charts, graphs and flags for instant visual recognition of where you need to focus your energy.
Hover Help that provides insightful financial education.
See definitions of key metrics and performance indicators, along with possible causes and potential solutions when those measurements are lower than ideal.
Personalize industry metrics with custom flags.
Customize goals and red flags according to benchmarks you set, and examine your performance at every level
Find hidden cash.
By comparing a business to the averages of the industry, Finagraph instantly identifies where pockets of cash may be hiding.
Examine key trends that impact the financial performance of a business.
Analyze profits, COGS, sales and expenses in monthly, quarterly, or yearly views from detailed printable charts.